3 times money didn’t buy happiness

"The only function of economic forecasting is to make astrology look respectable." - John Kenneth Galbraith
In the history of share markets, you’ll find that the things that really move share markets quickly are surprises. COVID is a good example. While a few exceptional people saw something big happening prior to the global outbreak, most did not and of those that did, most saw it as a lower-level event, like bird-flu. The economic shock was large and unexpected, and prices moved quickly once that was appreciated.
By contrast, one of the most anticipated events (thus anything but a surprise) is the US election. And with the election about a month away, we thought it was a good time to make two interesting observations.
What do we mean?
Let’s start with the first observation, and move on to the second, with the intention of highlighting the folly of paying too much attention to “events” when investing.
First, the party in the White House makes almost no difference to the returns of the New Zealand share market. According to Russell Investments (using Morningstar data from 1994 to 2023), the New Zealand share market has averaged about a 12% return with Republicans in the White House compared to 10% for Democrats.
The chart below, provides a more detailed and longer dated analysis based on US market data. It shows that the average return of a 60% share and 40% bond portfolio the year after a US presidential election, starting from the 1932 Roosevelt - Hoover election and going all the way through to the 2020 Biden - Trump election. The average post-election year return of a 60/40 portfolio has been a useful, but not astounding, 8.5%.
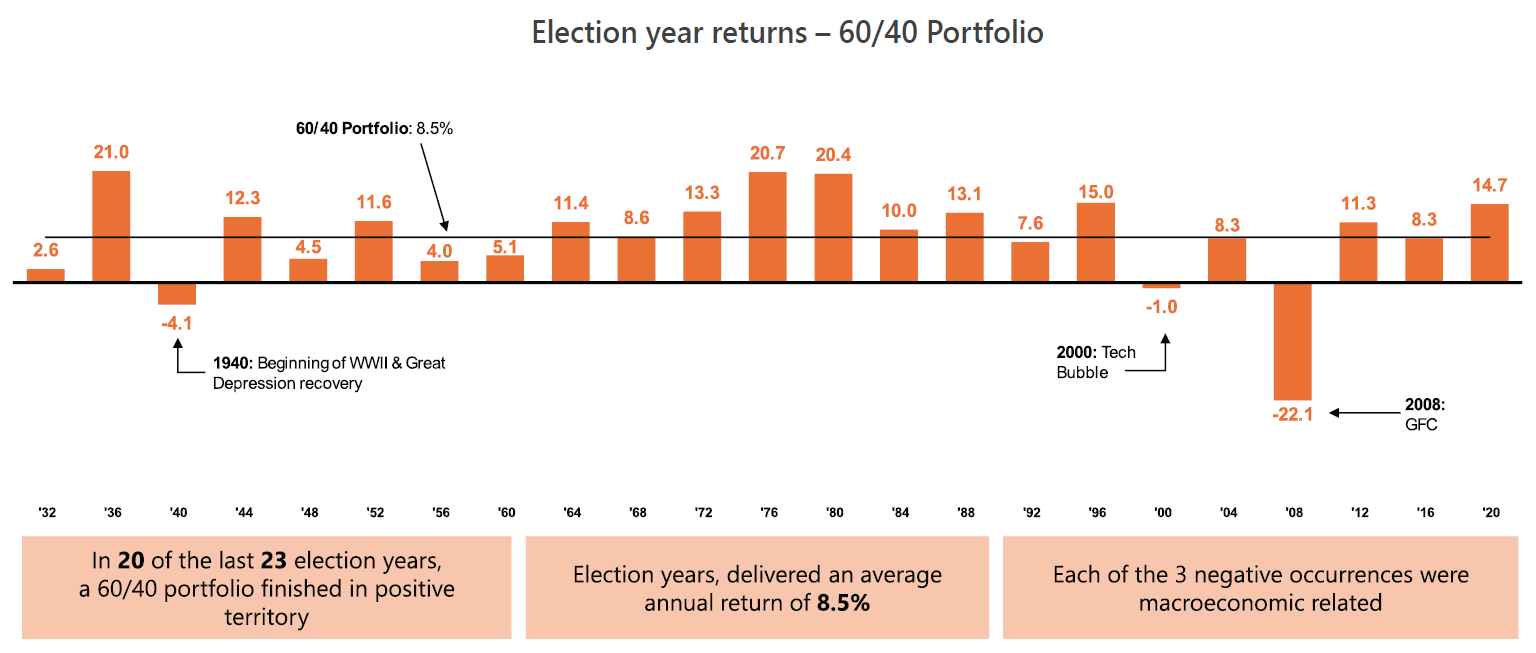
Chart supplied by Russell Investments.
The chart also shows that in 20 out of 23 years there was a positive return the year after an election. In the three years there wasn’t a positive return, the reason had nothing to do with the election itself.
Based on this evidence, our earlier assertion that “Presidential elections tend not to have an important impact on share prices” is very reasonable.
This leads us to the much more interesting assertion, “Whether the New Zealand Warriors make the NRL Top 8 Finals, has a massive impact on share prices.”
Since 1994, the New Zealand Warriors have made the Top 8 in the following years: 2001-03, 2007-08, 2010-11, 2017-18, and 2023. While that’s great for the Warriors, it hasn’t corresponded to good news for the New Zealand share market. It turns out that when the Warriors make the Top 8 the average New Zealand share market return has been 3%. When they finish outside the Top 8, the average return is a much more attractive 13%.
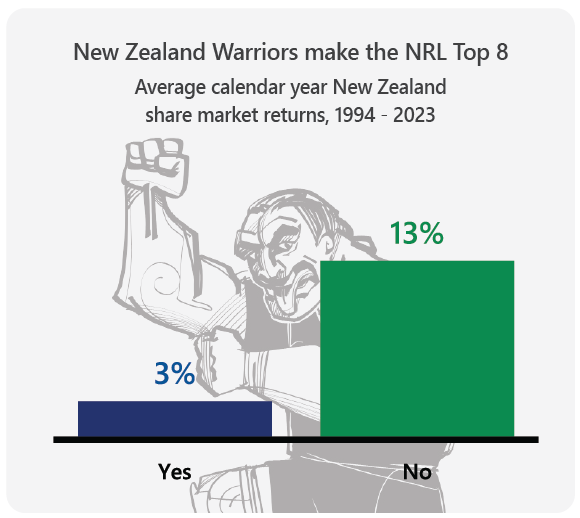
Source : Morningstar. Stocks represented by S&P/NZX All TR NZD Index over calendar years 1994 - 2023. Index returns represent past performance, are not a guarantee of futures performance, and are not indicative of any specific investment. Indexes are unmanaged and cannot be invested in directly.
What are we meant to make of this data? Do we cheer for the Warriors and get poor share market returns or cheer against them and enjoy the investment bonanza?
The answer is cheer for the Warriors, because how they perform is entirely unrelated to the performance of the share market. The data presented above, although accurate, is also completely spurious.
Spurious relationships occur when the data looks meaningful, but the results are actually random. The media love spurious relationships and simple narratives (like elections) because they give the false sense that we can control the future. Here are a few additional relationships that have made headlines in the past but have subsequently proved not to be insightful:
The Negative Divergence Indicator
The Hindenburg Omen
The Titanic Syndrome
The McClellan Oscillator
There are no lack of indicators, theories and prognostications (often with scary names) about what future share prices will be. Some of these theories come with impressive backward-looking statistics and even some economic or geo-political rationale. Most will provide great fodder for click-bait headlines but will prove no more effective in forecasting prices than tarot cards or tea leaves.
The unfortunate truth is relatively boring. Prices are affected by anticipated earnings. Anticipated earnings trend up but can go down in concert with surprising economic or geopolitical events. Markets are always trying to anticipate these events so once you trade, the odds of an event one way or the other is likely already in the price. The best approach for a long-term investor is to hold your position in all markets unless you need to spend the money.
And lastly, if you do need to spend in the short term, this should be reflected in bond/cash allocations which aren’t as volatile as shares. This will help to protect your purchasing power even if the prices drop at the wrong time for you.
This may sound rather dull, but as Paul Samuelson, one of the first Nobel Prize winners in Economics, wisely stated many years ago -
"Investing should be dull. It shouldn't be exciting. Investing should be more like watching paint dry or grass grow. If you want excitement, take $800 and go to Las Vegas... It is not easy to get rich in Las Vegas, at Churchill Downs (Kentucky horse race track), or at the local Merrill Lynch (share trader) office."
Still, the “Warriors Omen” does have a certain ring to it, don’t you think?